Tottempudi Software Solutions

TraceIT · Our product

Monitoring that tells you the truth

One console for infrastructure, applications, mobile crashes, user behaviour and alerting. It is built on a rule we hold everywhere in it: a screen never shows a number it did not measure. When something cannot be read, the page says so and says why, instead of showing a zero.

Go through the screens Ask for a demonstration

How it is different

Four things it does differently

  • Delivered, not accepted.Every notification is acknowledged by the device that received it, so the console reports what arrived rather than what was sent.
  • Interaction tracking with no markup changes.See which element a person tapped without asking your developers to annotate anything first.
  • Crashes and behaviour together.Crash-free users and sessions beside the actions that led to them.
  • Your content stays yours.Notification content never passes through a third party.

Go through the product

Six screens, read three ways

Choose who you are, then step through the screens. The screens are the product itself; the sentence under each one says what it tells someone in your position.
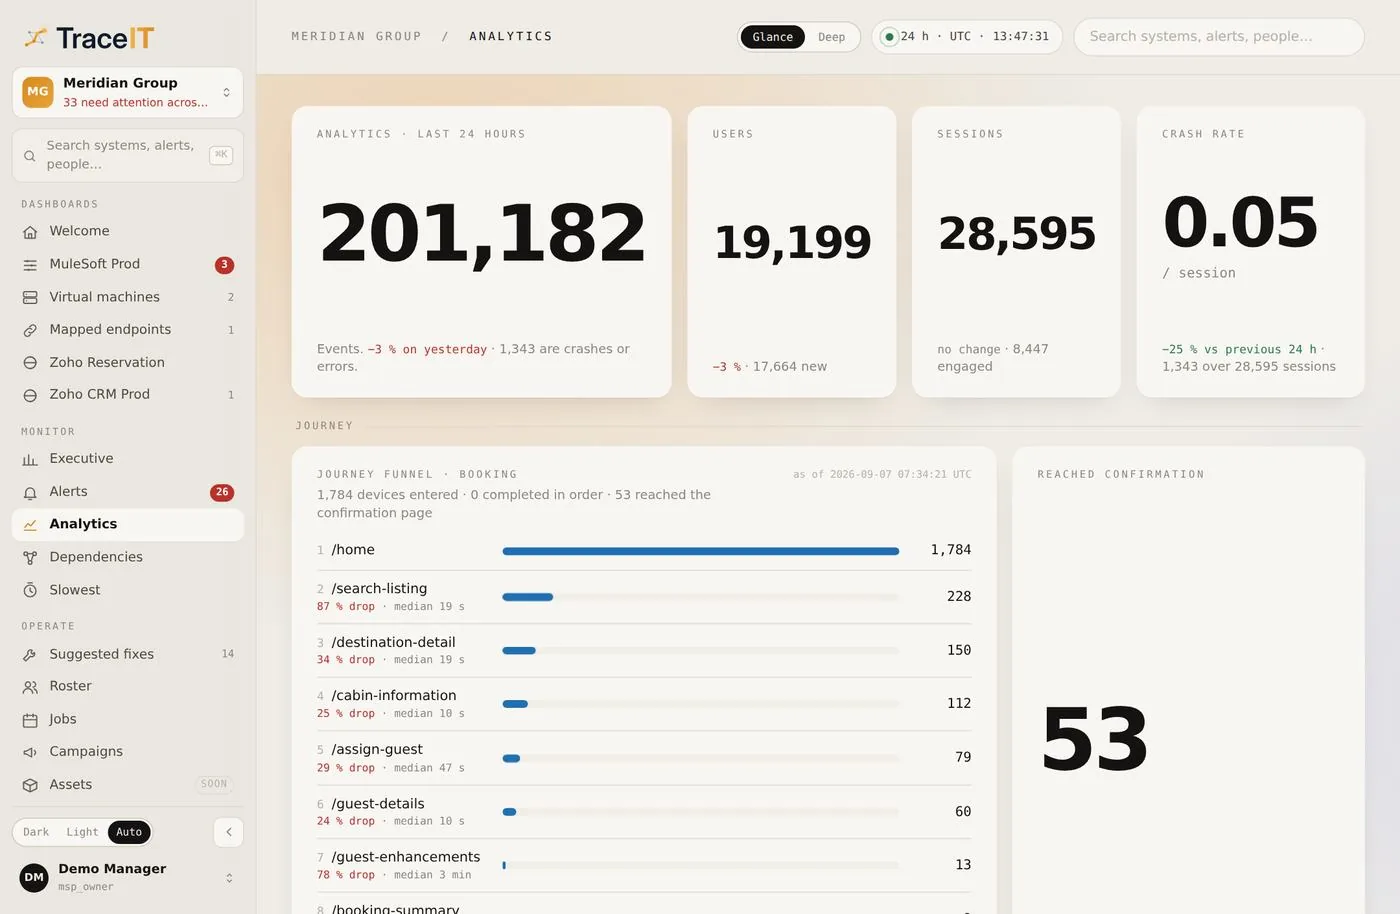
  1. TraceIT — Analytics, shown with demonstration data

    01 · Behaviour

    Analytics

    What people actually did: sessions, journeys, and the step where they stopped — each figure traceable to the reading that produced it.
    For a school or college group
    Which parts of the parent and student portal get used, where an admission or fee payment loses people, and which campus has gone quiet.
    For a hospital or clinic group
    Where a registration or appointment journey stalls, how long a patient spends on each step, and which department’s screens are slowest.
    For an IT and platform team
    Real traffic, real sessions, a real crash rate — and an honest empty state wherever a reading did not arrive.
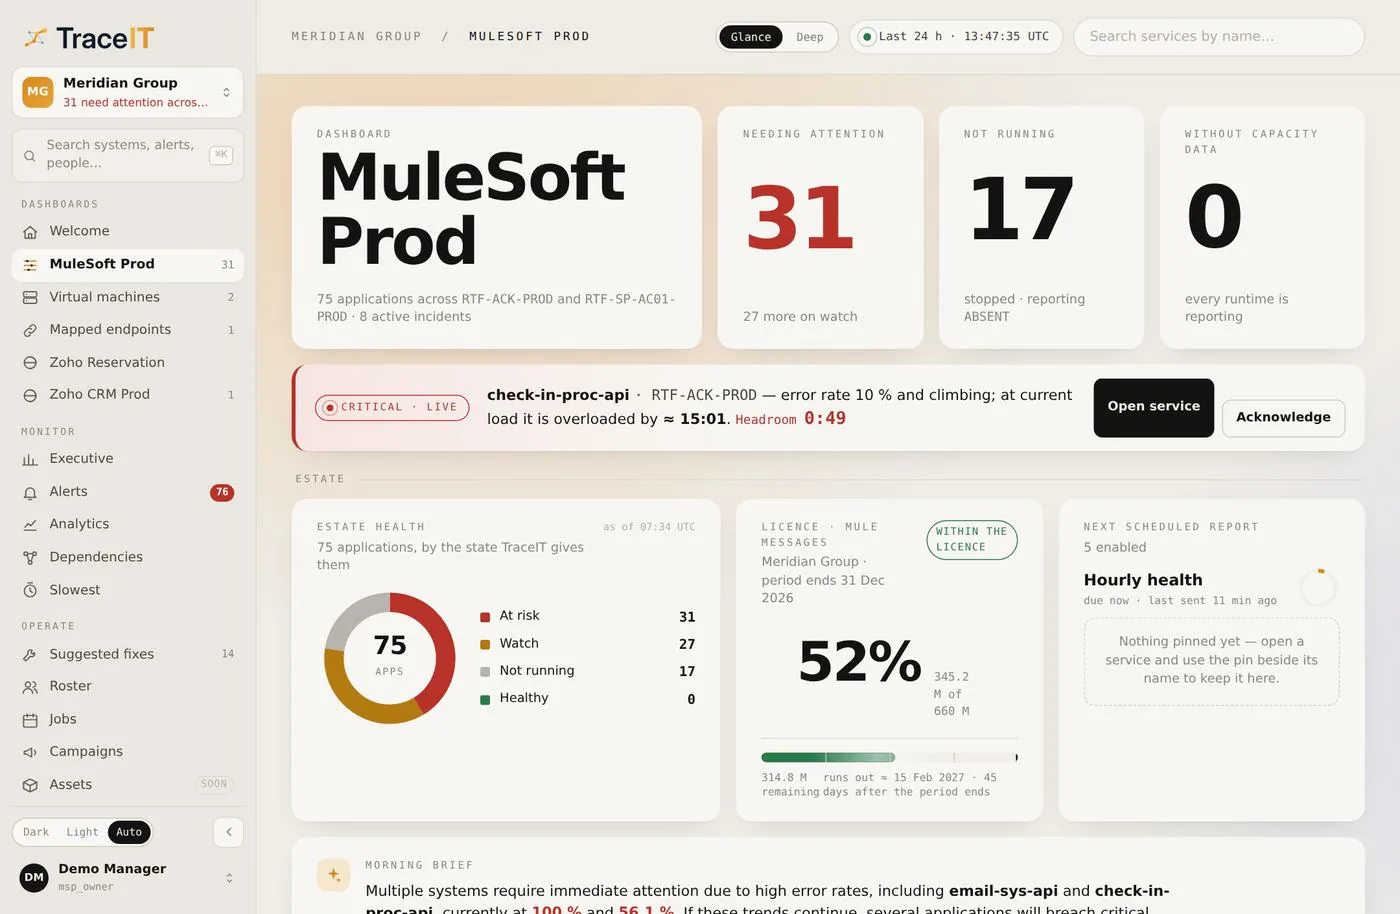
  2. TraceIT — System dashboard, shown with demonstration data

    02 · One system

    System dashboard

    A single system on one page: its services, its endpoints, its licences, and what changed since you last looked.
    For a school or college group
    Every campus system in one view — the ERP, the LMS, the payment gateway — with whatever needs attention sorted to the top.
    For a hospital or clinic group
    The HIS, pharmacy, laboratory interfaces and the integration layer between them, together rather than in four vendor consoles.
    For an IT and platform team
    Services, endpoints, virtual machines and licence consumption, with the section that failed saying so instead of showing a zero.
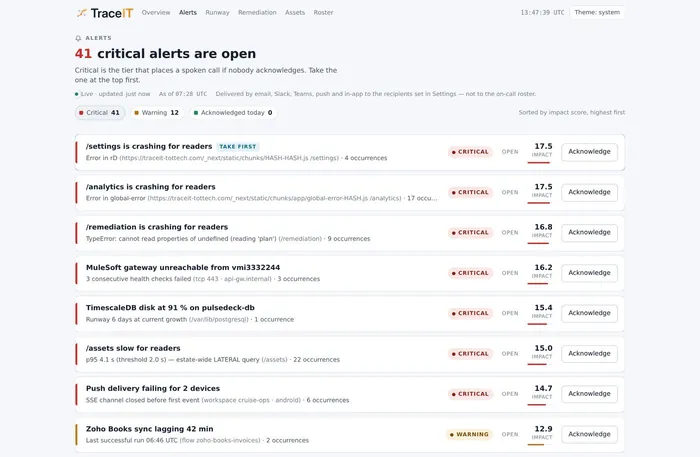
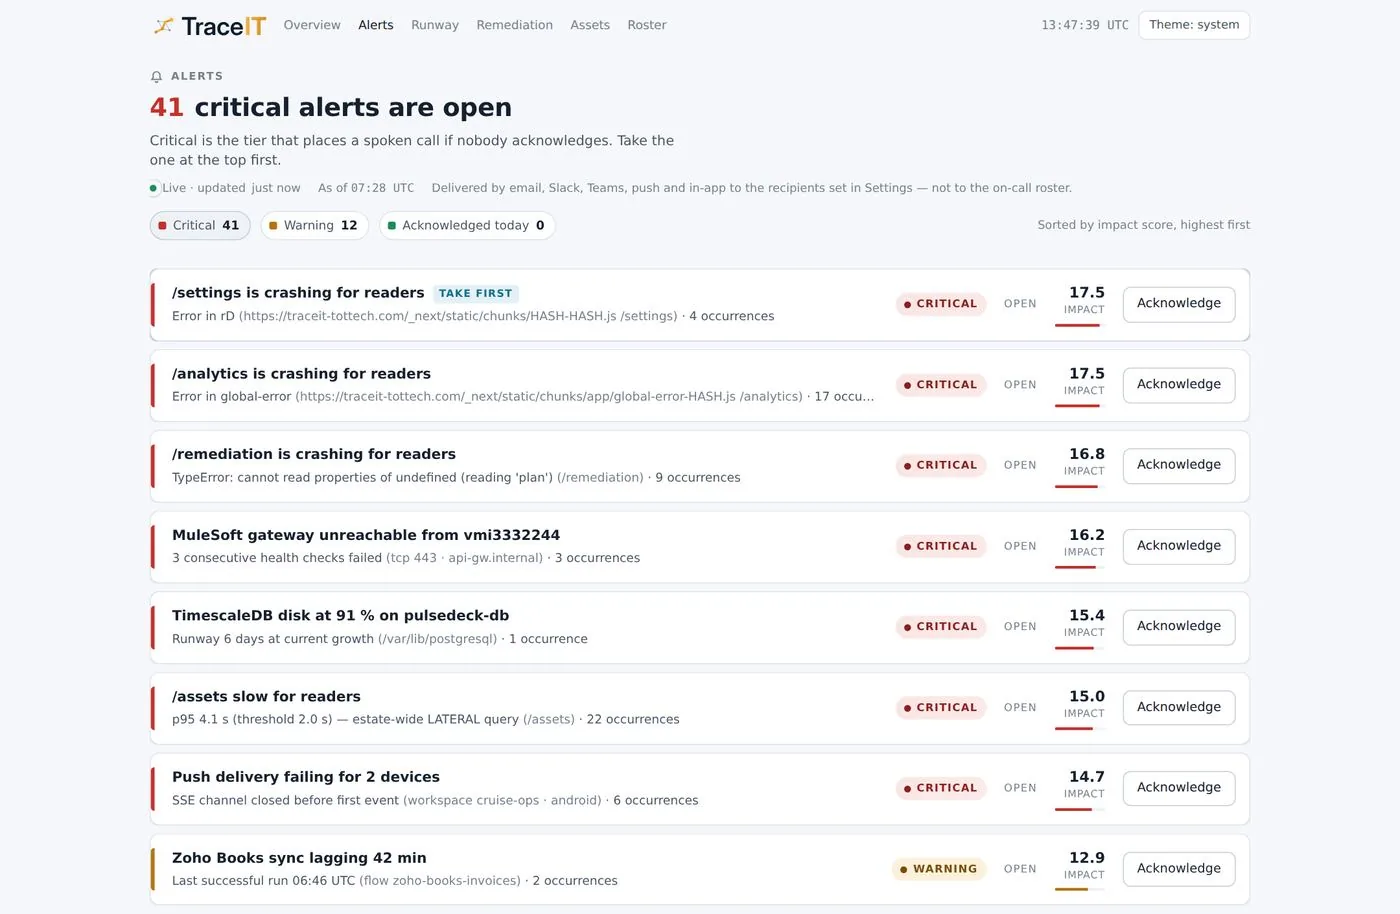
  3. TraceIT — Alerts and acknowledgement, shown with demonstration data

    03 · Alerts

    Alerts and acknowledgement

    What needs attention, who was told, and whether the device they carry confirmed it.
    For a school or college group
    On results day, the person on call was told on a phone that confirmed it — not an email that may have been filtered at two in the morning.
    For a hospital or clinic group
    An on-call clinician’s handset acknowledged the alert. The console reports what arrived, not what was sent.
    For an IT and platform team
    Delivery is proven per device, so a missed page is a fact you can point at rather than an argument after the incident.
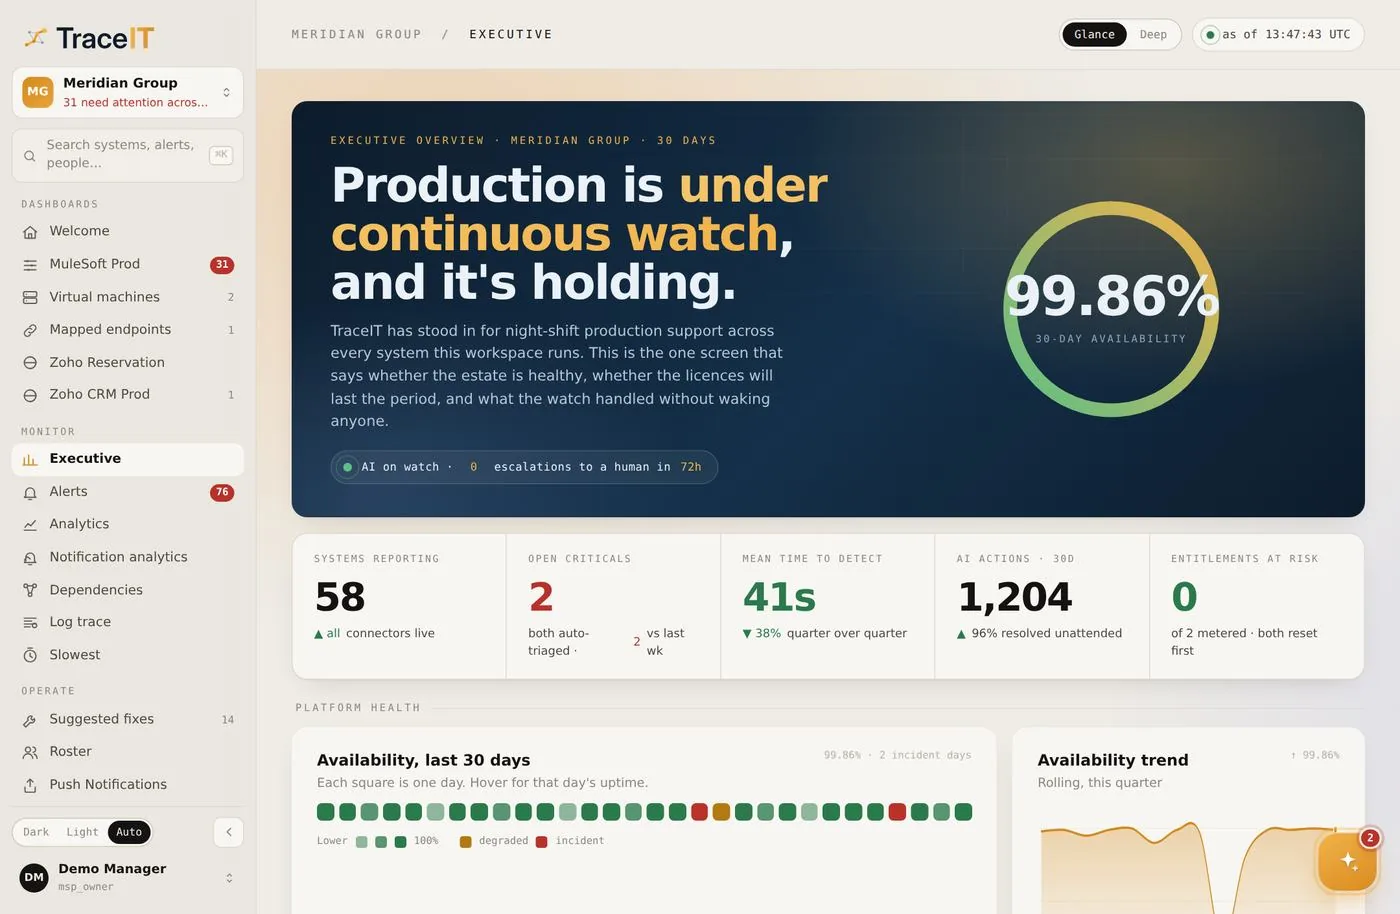
  4. TraceIT — Executive view, shown with demonstration data

    04 · Executive

    Executive view

    The period in numbers for someone who does not open consoles — availability, incidents, and what was actually fixed.
    For a school or college group
    A page a trust board or a principal can read without a translator: uptime, incidents, and the work that closed them.
    For a hospital or clinic group
    The month as a medical director needs it — availability of the systems clinicians depend on, and where it slipped.
    For an IT and platform team
    The figures you take into a review, each one linked back to the reading behind it rather than retyped into a slide.
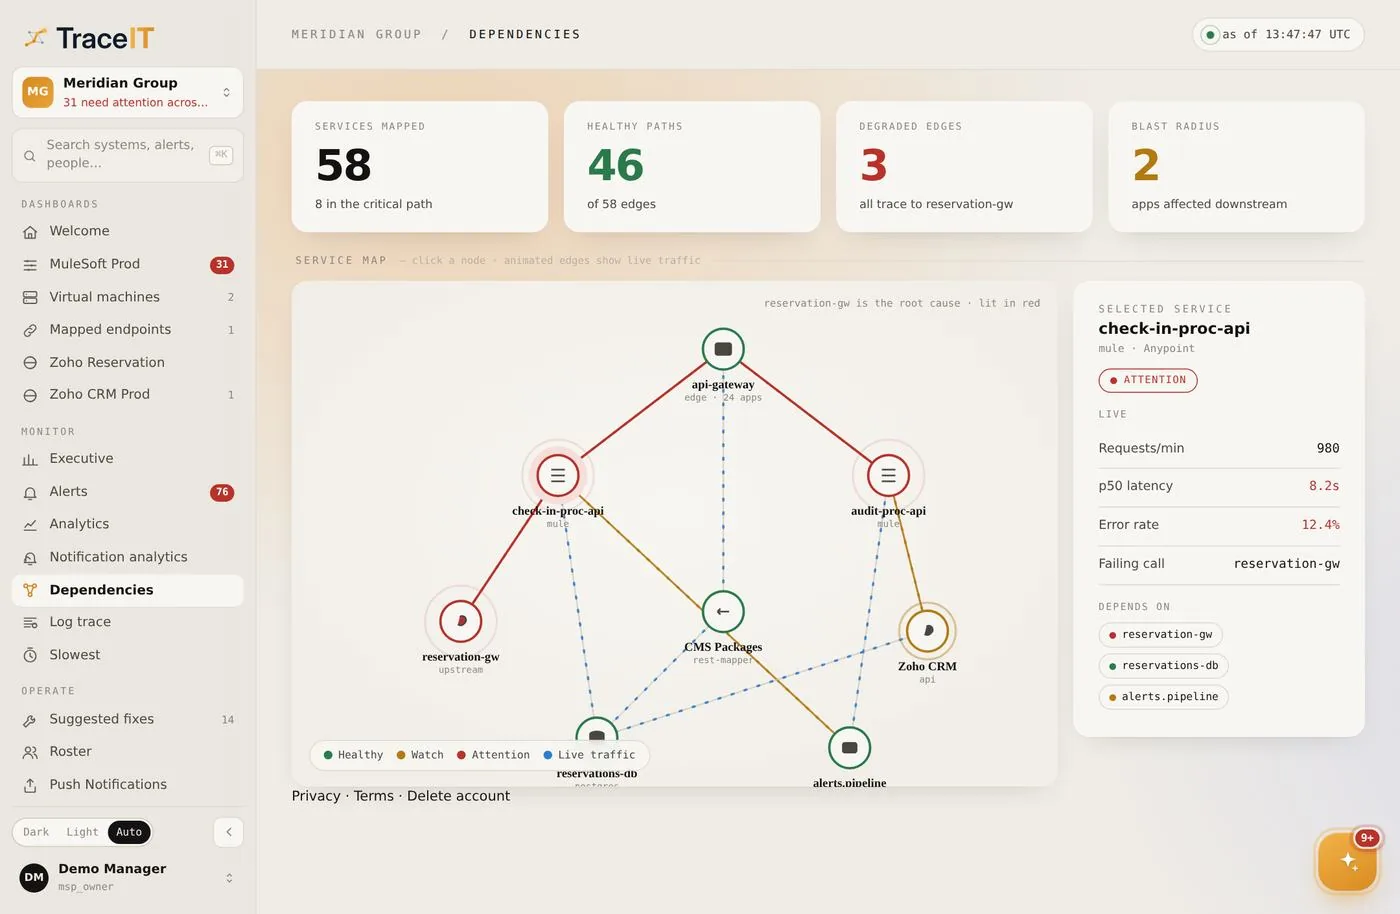
  5. TraceIT — Dependencies, shown with demonstration data

    05 · Dependencies

    Dependencies

    What depends on what, so an outage has a blast radius you can see before it happens.
    For a school or college group
    If the payment gateway goes, you know immediately which campuses and which journeys stop with it.
    For a hospital or clinic group
    If the laboratory interface goes, you know which wards will feel it and in what order.
    For an IT and platform team
    Blast radius before the incident, not reconstructed from memory during it.
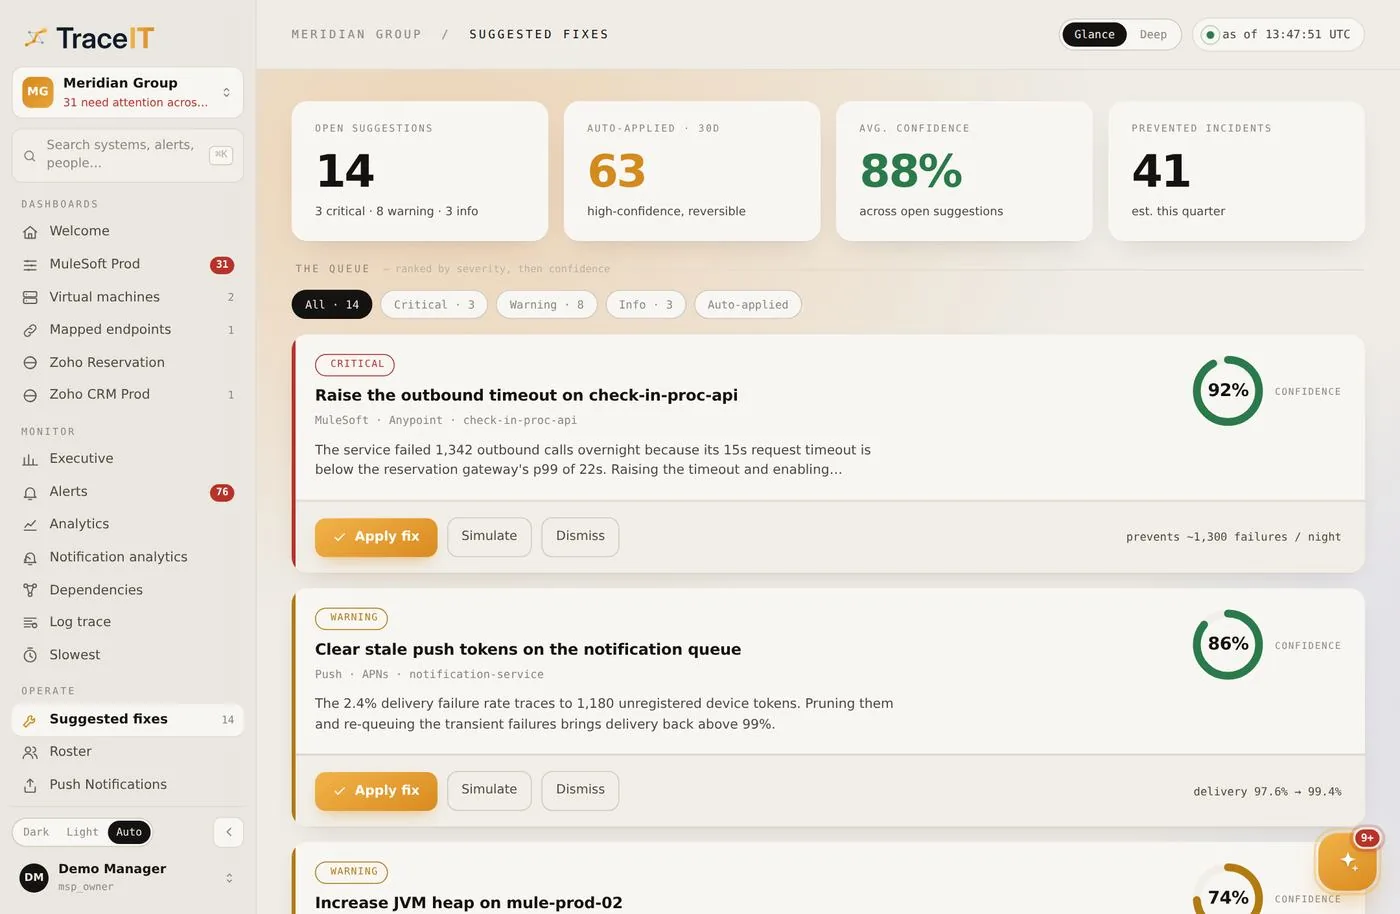
  6. TraceIT — Suggested fixes, shown with demonstration data

    06 · Suggested fixes

    Suggested fixes

    The specific change that would stop this recurring, ranked, with the evidence that named it.

    For a school or college group
    A small IT team spends its week on the one change that matters, not on the loudest complaint.
    For a hospital or clinic group
    The change that ends a recurring failure, with the measurement that identified it attached.
    For an IT and platform team
    Prioritised and evidenced — never a generic recommendation you have to go and verify yourself.

These are TraceIT’s own screens. The tenant, the people and the figures are a demonstration — no customer’s data appears here. The product is the same for every sector; what changes is what you read off it.

The rule

A wrong value is worse than a missing one

When a reading does not arrive, most screens still have to show something. A zero looks healthy. TraceIT shows the gap and the reason for it, so nobody makes a decision on a number that was never measured.

A screen that fills the gapAll clear
Availability
100%
Error rate
0%
Response time
0 ms

Looks healthy. None of these numbers was measured — the source stopped reporting, and the gaps were filled with zeros.

TraceIT, same momentIllustration
Availability
Not measured
No probe has reported in this window.
Error rate
Not measured
The log source stopped sending.
Response time
Not measured
No request completed in this window.

Tells you what to check. The absence is the finding: the source went quiet, and the screen says so.

Illustration. Neither panel shows real readings.

Delivered, not accepted

An alert is not delivered until the device says so

Most of the path an alert takes can succeed without anyone being told. TraceIT reports the step that proves it: the device that received it confirming it arrived.

  1. 01

    Alert raised

    Something needs attention.

  2. 02

    Sent

    Accepted by a gateway for delivery.

    Not proof of anything
  3. 03

    Arrived

    The device that received it confirms it.

    Reported as delivered
  4. 04

    Acknowledged

    The person on call confirms they have it.

What it watches

The systems you depend on, in one console

Infrastructure and the applications on it — and your own web and mobile apps: how people use them, where they crash, and whether your notifications arrived.

  • Virtual machines
  • Databases
  • Websites and endpoints
  • Integration platforms such as MuleSoft Anypoint
  • Business applications such as Zoho
  • Log platforms

By sector

The same console, read by three kinds of team

Industries

A school or college group

Which parts of the parent and student portal get used, where an admission or fee payment loses people, and which campus has gone quiet.

A hospital or clinic group

Where a registration or appointment journey stalls, how long a patient spends on each step, and which department’s screens are slowest.

An IT and platform team

Real traffic, real sessions, a real crash rate — and an honest empty state wherever a reading did not arrive.

Contact

See TraceIT on a call.

Tell us what you run and who needs to know when it breaks. We will walk you through the product.

Ask for a demonstration [email protected]